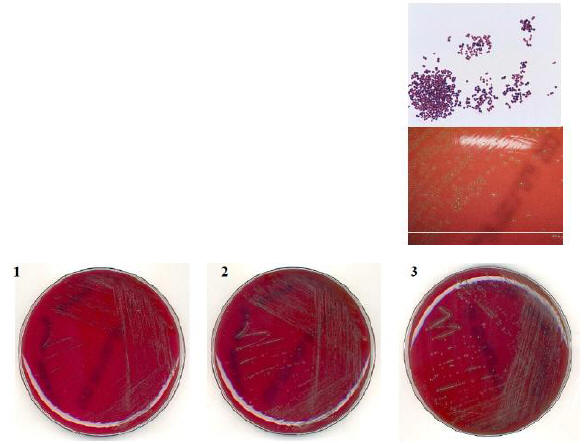
Figure 1. Microscopy and colonial morphology of A. viridans

Microscopy and close up after growth in C02 in 48 h. Plate photos after growth in 24h (1) and 48h (2) (bioMerieux Columbia 5% sheep blood agar; gram stain: Huckert's formula (safranin counterstain); Gram-photos are 1000x). Photos from and with permission from Marie Delsarte and Alain Le Coustumier, Cohors, France.
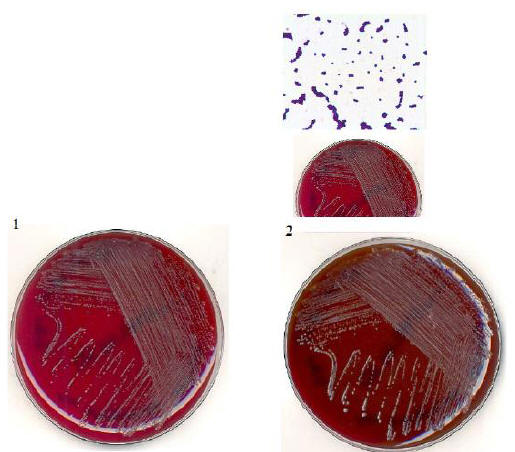
Figure 2. Microscopy and colonial morphology of A. urinae

Microscopy and close up after growth in C02 in 48 h. Plate photos after growth in 24h (1) and 48h (2) and 72h (3) (bioMerieux Columbia 5% sheep blood agar; gram stain: Huckert's formula (safranin counterstain); Gram-photos are 1000x). Photos from and with permission from Marie Delsarte and Alain Le Coustumier, Cohors, France.
Figure 3. Microscopy and colonial morphology of A. sanguinicola

Microscopy and close up after growth in C02 in 48 h. Plate photos after growth in 24h (1) and 48h (2) (bioMerieux Columbia 5% sheep blood agar; gram stain: Huckert's formula (safranin counterstain); Gram-photos are 1000x). Photos from and with permission from Marie Delsarte and Alain Le Coustumier, Cohors, France.
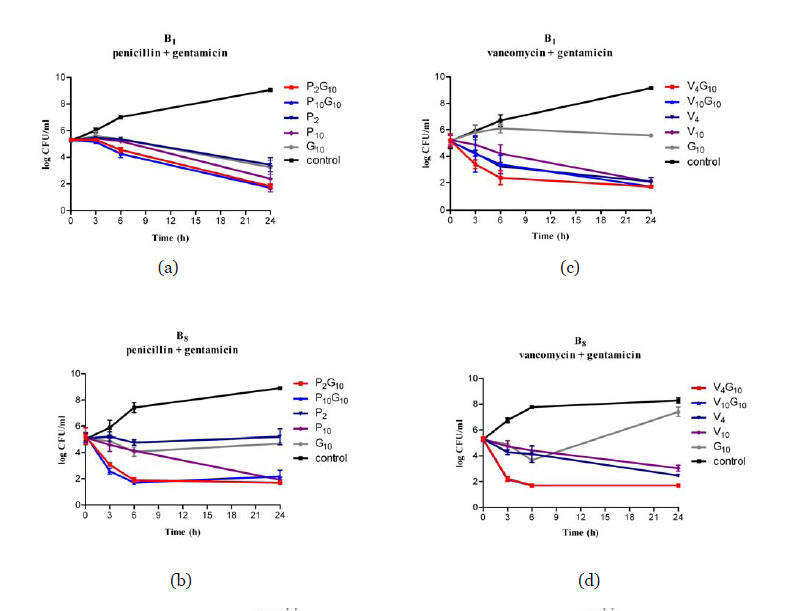
Figure 4. Time-kill curves of two. A. urinae blood-culture isolates (B1 and B8) (average of two or three experiments).
(a) Isolate B1, penicillin + gentamicin; (b) isolate B8, penicillin + gentamicin; (c) isolate B1, vancomycin + gentamicin; (d) isolate B8, vancomycin+ gentamicin. Error bars are standard deviation. A solid line marks the detection limit. Symbols for (a) and (b): ×, P2G10;▲, P10G10;▼, P2; ♦, P10; ●, G10; *, control. Symbols for (c) and (d): ×, V4 G10; ▲, V10 G10; ▼, V4; ♦, V10; ●, G10; *, control.

Table 1. Phenotypic characteristics of Aerococcus species and other catalase-negative, Gram-positive, non-chain forming cocci, which have been isolated from humans.
|
|
Hemo-lysis |
Vancomycin susceptibility |
6.5% NaCl |
Pyrrolidonyl aminopeptidase |
Leucine aminopeptidase |
Esculin hydrolysis |
Acid production from: |
||||
| sucrose | trehalose | mannitol | maltose | lactose | |||||||
|
A. urinae |
α |
S |
+ |
- |
+ |
-/(+) |
+ |
- |
+ |
- |
- |
|
A. sanguinicola |
α |
S |
+ |
+ |
+ |
+ |
+ |
+ |
- |
+ |
V |
|
A. viridans |
α |
S |
+ |
+ |
- |
+ |
+ |
+ |
V |
V |
V |
|
aA. christensenii |
α |
S |
+ |
- |
+ |
- |
- |
- |
- |
- |
- |
|
aA. urinaehominis |
α |
S |
+ |
- |
- |
+ |
+ |
- |
- |
+ |
- |
|
|
|
|
|
|
|
|
|
|
|
|
|
|
Dolosigranulum pigrum |
n |
S |
+ |
+ |
+ |
+ |
- |
- |
- |
- |
- |
|
Helcococcus kunzii |
n |
S |
+ |
+ |
- |
+ |
- |
- |
- |
- |
- |
|
Pediococcus spp. |
α |
R |
+ |
- |
+ |
+ |
V |
|
|
|
|
|
Gemella spp. |
n/α |
S |
- |
+ |
V |
- |
+ |
|
|
|
|
|
Alloiococcus otitidisb |
n |
S |
+ |
+ |
+ |
- |
- |
|
|
|
|
Abbreviations: Hemolysis = hemolytic reaction on agar containing 5% sheep or horse blood; n = no hemolysis, V = variable.
a: data based on examination of one strain each (Reference: 11)
b: Alloiococcus otitidis usually gives a weak positive reaction in the catalase test. Have been isolated from inner ear infections.
Table 2. Published data on minimal inhibitory concentrations (MICs) of antimicrobial agents for A. urinae and A. sanguinicolaa
|
Antibiotic (Breakpointsb: S;R in μg/ml) |
A. urinae |
A. sanguinicola |
||||
|
|
Range in μg/ml |
MIC50/MIC90 |
No. of strains (Reference) |
Range in μg/ml
|
MIC50/MIC90 |
No. of strains; (Reference) |
|
Penicillin G (≤0.25; >2) |
0.032-0.25 0.06 |
0.064/0.125 0.06/0.06 |
n = 56; (45) n = 10; (12) |
0.03 |
0.03/0.03 |
n = 15; (22) |
|
Amoxicillin (≤0.25; >2) |
<0.032-0.25 0.08-0.32 |
0.064/0.125 0.23/0.32 |
n = 56;(45) n = 20; (5) |
0.03 0.16-0.32 |
0.03/0.03 0.16/0.23 |
n = 15; (22) n = 8; (5) |
|
Piperacillin (≤0.25; >2) |
0.06-0.5 |
0.125/0.5 |
n = 56; (45) |
|
|
|
|
Cefuroxim (≤0.5; >0.5) |
|
|
|
0.25-1 |
0.5/1 |
n = 15; (22) |
|
Cefotaxim (≤0.5; >0.5) |
|
|
|
0.06-0.25 |
0.12/0.25 |
n = 15; (22) |
|
Ceftriaxone (≤0.5; >0.5) |
0.125-32 |
2/8 |
n = 56; (45) |
|
|
|
|
Cefipime (≤0.5; >0.5) |
0.032-8 |
0.25/1 |
n = 56; (45) |
|
|
|
|
Meropenem (≤2; >2) |
|
|
|
0.06-2 |
0.06/1.0 |
n = 15; (22) |
|
Gentamicin - |
4-512 1.5-48 |
64/128 4/32 |
n = 56; (45) n = 20; (5) |
6-24 |
16/24 |
n = 8; (5) |
|
Netilmicin - |
4-256 |
32/64 |
n = 56; (45) |
|
|
|
|
Amikacin - |
16-1024 |
256/512 |
n = 56; (45) |
|
|
|
|
Vancomycin - |
0.5-1 0.25-0.5 0.75-1.5 |
0.5/1 0.5/0.5 1/1 |
n = 56; (45) n = 10; (12) n = 20; (5) |
0.12-0.25 0.75-1 |
0.25/0.25 1/1 |
n = 15; (22) n = 8; (5) |
|
Teicoplanin - |
0.19-1 |
0.5/0.75 |
n = 20; (5) |
0.19-0.75 |
0.38/0.5 |
n = 8; (5) |
|
Rifampicin (≤0.06; >0.5) |
<0.004-32 |
0.032/0.032 |
n = 56; (45) |
2 |
2/2 |
n = 15; (22) |
|
Erythromycin (≤0.25; >0.5) |
0.125-2 |
0.5/1 |
n = 56; (45) |
0.03-0.25 |
0.12/0.25 |
n = 15; (22) |
|
Clindamycin (≤0.5; >0.5) |
|
|
|
0.03-0.5 |
0.25/0.5 |
n = 15; (22) |
|
Tetracycline |
1-4 |
2/2 |
n = 56; (45) |
2 |
2/2 |
n = 15; (22) |
|
Ciprofloxacin - |
0.125-4 0.094->32 |
1/2 0.5/>32 |
n = 56; (45) n = 20; (5) |
1-4 0.19->32 |
1/4 0.75/>32 |
n = 15; (22) n = 8; (5) |
|
Ofloxacin - |
0.38->32 |
2/>32 |
n = 20; (5) |
0.75->32 |
4/>32 |
n = 8; (5) |
|
Levofloxacin (≤1; >2) |
|
|
|
0.5-16 |
1/16 |
n = 15; (22) |
|
Trimetoprim - |
16->128 |
>128/>128 |
n = 56; (45) |
0.25-4 |
1/2 |
n = 15; (22) |
|
Co-trimoxazole (≤1; >2) |
>32 |
>32/>32 |
n = 20; (5) |
0.094-0.5 |
0.25/0.5 |
n = 8; (5) |
|
Fosfomycin - |
4-128 |
8/8 |
n = 20; (5) |
48-128 |
64/128 |
n = 8; (5) |
|
Chloramphenicol (≤8; >8) |
|
|
|
2-4 |
2/4 |
n = 15; (22) |
|
Quinopristin/ Dalfopristin - |
|
|
|
1 |
1/1 |
n = 15; (22) |
|
Linezolid (≤2; >4) |
|
|
|
2 |
2/2 |
n = 15; (22) |
a: Only data from publications examining >2 strains are given.
b: Breakpoints as recommended by The European Committee on Antimicrobial Susceptibility Testing (EUCAST). A – denotes that no breakpoints are given for non-hemolytic streptococci.
Table 3. Agar dilution MICs of 13 antimicrobial agents for A. urinae (n = 56) using 48 h of incubation in 5% CO2 atmosphere. The upper limit for
susceptibility for non beta-hemolytic streptococci according to CLSI (marked in blue) or EUCAST (marked in yellow) are given. Antibiotics, for which
no upper limits have been defined are given in red.
|
Antimicrobial |
MIC (mg/mL) |
|||||||||||||||||||
|
Agents |
<0.008 |
0.008 |
0.016 |
0.032 |
0.064 |
0.125 |
0.25 |
0.5 |
1.0 |
2.0 |
4.0 |
8.0 |
16 |
32 |
64 |
128 |
256 |
512 |
>512 |
|
|
Benzylpenicilllin |
|
|
|
17a |
24 |
13 |
2 |
|
|
|
|
|
|
|
|
|
|
|
|
|
|
Amoxycillin |
|
|
6b |
|
23 |
19 |
3 |
|
|
|
|
|
|
|
|
|
|
|
|
|
|
Piperacillin |
|
|
|
|
5 |
24 |
16 |
11 |
|
|
|
|
|
|
|
|
|
|
|
|
|
Ceftriaxone |
|
|
|
|
|
2 |
3 |
8 |
10 |
18 |
7 |
2 |
3 |
1 |
|
|
|
|
|
|
|
Cefipime |
|
|
|
1 |
3 |
8 |
23 |
7 |
9 |
3 |
|
1 |
|
|
|
|
|
|
|
|
|
Gentamicin |
|
|
|
|
|
|
|
|
|
|
1 |
1 |
4 |
13 |
27 |
9 |
1 |
|
|
|
|
Netilmicin |
|
|
|
|
|
|
|
|
|
|
2 |
4 |
7 |
29 |
13 |
|
1 |
|
|
|
|
Amikacin |
|
|
|
|
|
|
|
|
|
|
|
|
1 |
|
1 |
4 |
29 |
20 |
1 |
|
|
Vancomycin |
|
|
|
|
|
|
|
34 |
22 |
- |
|
|
|
|
|
|
|
|
|
|
|
Rifampicin |
6 |
1 |
14 |
29 |
4 |
1 |
|
|
|
|
|
|
|
|
1c |
|
|
|
|
|
|
Erythromycin |
|
|
|
|
|
2 |
9 |
|
23 |
17 |
5 |
|
|
|
|
|
|
|
|
|
|
Ciprofloxacin |
|
|
|
|
|
1 |
3 |
9 |
37 |
5 |
1 |
|
|
|
|
|
|
|
|
|
|
Oxytetracycline |
|
|
|
|
|
|
|
|
20 |
35 |
1d |
|
|
|
|
|
|
|
|
|
CLSI: Clinical and Laboratory Standards Institute, Wayne, Pennsylvania, USA. EUCAST: European Committee on Antimicrobial Susceptibility Testing (see references)
a No. of strains
b MIC <0.032 mg/L
c MIC >32 mg/L
d MIC >2 mg/L
.